What is Going On In This Graph?
Graph #1: Colleges Slope-Intercept Form

1. More than half do not know that federal loan repayment begins 6 months after graduation
2. Those who do know expect payments to be between 200-300 on average
3. 1 in 4 graduates say if they had known more about loans they would have chosen higher-income careers
4. 2 million Americans age 60 and up carry student loans either for themselves or for their children.
Article
What Surprised you?
What do you have questions about?
Link to Graph
CrossTalk Frayer Sheet
Assignment
Google doc
Graphs for Assignment: DESMOS
Code: X6GK8T
Graph #2: Men in the Workforce Approximate Linear Regression

1. Frayer:
Individual to Group Understanding
What do you notice about the graph?
What do you wonder about the graph?
The story this graph is telling is......
2. Regression: LINK
Desmos Graphs: 5JZ2SZ
Assignment Link
3.Articles
a. Japan Article #1, Article #2
b. United States
c. Germany
d. France
Site reasons and add to your original story of what the graph is telling...
Graph #3: Judicial Martin Quinn Score: Systems of Linear Equations

1. Graph:
1. What do you notice about the graph?
2. What do you wonder about the graph?
3. The story the graph is telling is.....
2. Let's Understand this graph a little more
a. Breaking Down the graph
b. Martin- Quinn Frayer: Each box is question in the interview
Conversation with Andrew Martin
3. Approximate systems based on intervals
a. Desmos: Graphs Code XKHTHC
b. Assignment
4. The story the graph is telling...? Minimum 1/2 page write up using stats and info from the activity.
How can you apply what you have learned to explain the graph?
Graph #4: Normal Distribution Summer Temps
1. Link to Graph
a. What do you notice?
b. What do you wonder?
c. What do you think this graph is telling
2. Articles:
link 1
link2
2. Impacts: Video
a. What do you notice?
b. What do you wonder?
c. What do you think this graph is telling
2. Articles:
link 1
link2
2. Impacts: Video
Summer Temps 1951-1980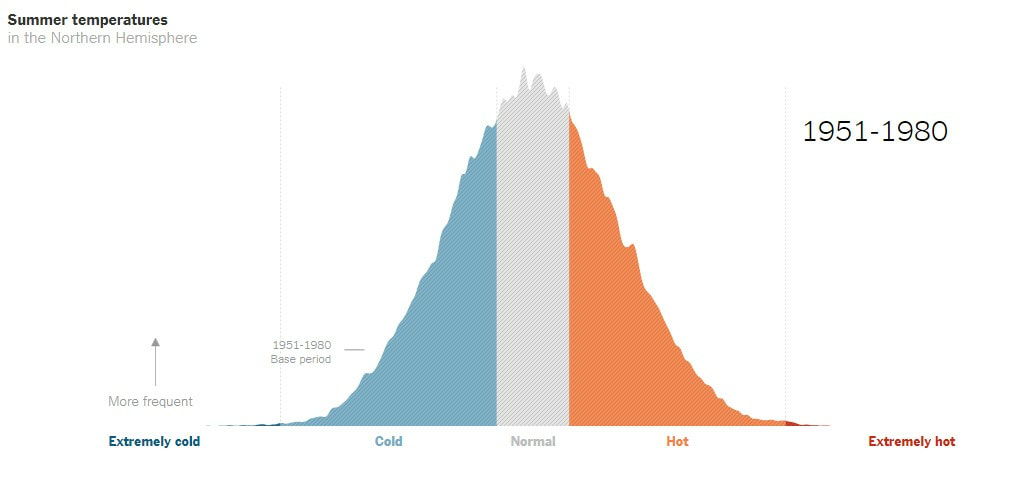
Summer Temps 1994-2004
|
Summer Temps 1983-1993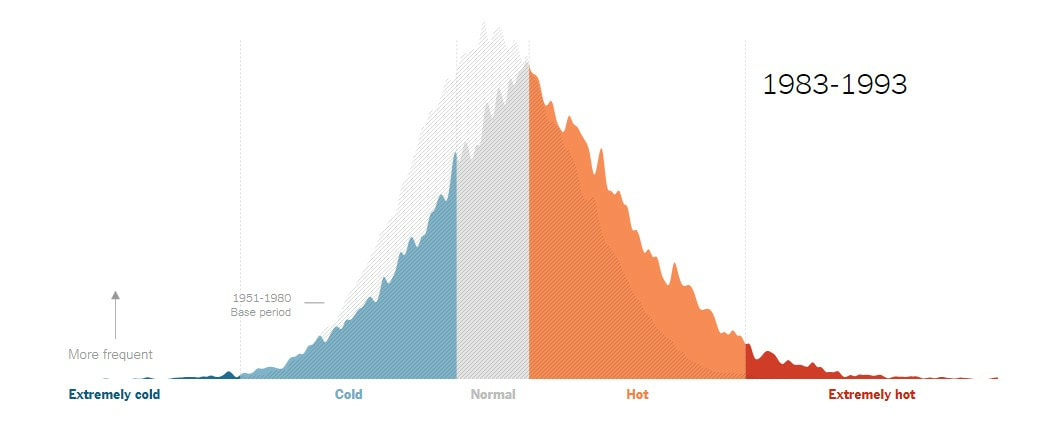
Summer Temps 2005-2015
|
